How to Write a Thesis in LaTeX (Part 3): Figures, Subfigures and Tables
Part 1 | Part 2 | Part 3 | Part 4 | Part 5
Author: Josh Cassidy (August 2013)
This five-part series of articles uses a combination of video and textual descriptions to teach the basics of writing a thesis using LaTeX. These tutorials were first published on the original ShareLateX blog site during August 2013; consequently, today's editor interface (Overleaf) has changed considerably due to the development of ShareLaTeX and the subsequent merger of ShareLaTeX and Overleaf. However, much of the content is still relevant and teaches you some basic LaTeX—skills and expertise that will apply across all platforms.
In the previous post we looked at configuring the page layout of our thesis using the geometry and fancyhdr packages. In this post we're going to look at using images and tables.
If you've never added images or tables into a LaTeX document, I recommend you first check out the relevant posts in our beginners tutorial series. You can see our video tutorial on using images in LaTeX and video tutorial on tables.
Images
For this project, every image we use we will store in the images folder to keep everything tidy. In the first post we prepared the document for images by loading up the graphicx package and by informing LaTeX where the images are stored using the \graphicspath command. Whenever we add an image into our thesis, we will use the figure environment. Here's an example:
\begin{figure}[h]
\centering
\includegraphics[scale=0.5]{graph_a}
\caption{An example graph}
\label{fig:x cubed graph}
\end{figure}
Notice that I've halved the size of the image and used the position specifier h to put it in the document where the code is in the text.
It's really important to add captions to figures when writing a thesis. This is what it looks like compiled:
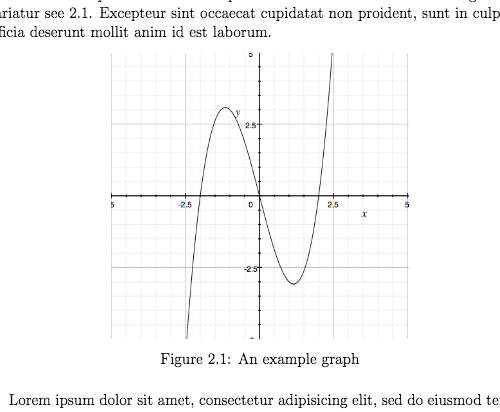
Notice that LaTeX has automatically numbered it according to what chapter it's part of. It is also really important to label each figure so you can accurately refer back to it in the text using the \ref command. If you added this in the text:
\ref{fig:x cubed graph}
LaTeX would give you the figure number '2.1' in place of this command in the pdf.
Subfigures
When writing a thesis you may want to include some slightly more complicated figures with multiple images. You can do this using subfigure environments inside a figure environment. Before we can do this though, we need to load up the caption and subcaption packages:
\usepackage{caption}
\usepackage{subcaption}
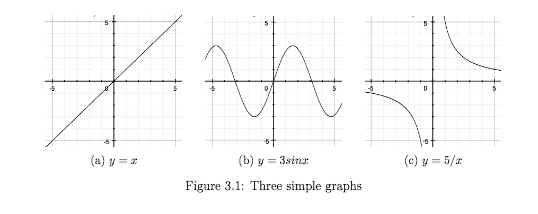
We'll do an example with three images along side each other with separate captions and labels. Here's some example code:
\begin{figure}
     \centering
     \begin{subfigure}[b]{0.3\textwidth}
         \centering
         \includegraphics[width=\textwidth]{graph1}
         \caption{$y=x$}
         \label{fig:y equals x}
     \end{subfigure}
     \hfill
     \begin{subfigure}[b]{0.3\textwidth}
         \centering
         \includegraphics[width=\textwidth]{graph2}
         \caption{$y=3\sin x$}
         \label{fig:three sin x}
     \end{subfigure}
     \hfill
     \begin{subfigure}[b]{0.3\textwidth}
         \centering
         \includegraphics[width=\textwidth]{graph3}
         \caption{$y=5/x$}
         \label{fig:five over x}
     \end{subfigure}
        \caption{Three simple graphs}
        \label{fig:three graphs}
\end{figure}
To start with, we create a new figure, centre it and then create a new subfigure. In the subfigure command we need to add a placement specifier and then give it a width. Because we want three images next to each other we set a width of 0.3 times the value of \textwidth. You need to make sure that the sum of the widths you specify for the subfigures is less than the text width if you want them all on the same line.
When we add the image in we need to specify the width using width= followed by the \textwidth command. The reason this works is because the text width within the subfigure is the width we specified in the \begin{subfigure} command, i.e. 0.3 times the normal text width (which is the value of \textwidth).
Next we give the subfigure a separate caption and label. We can then end the subfigure and add the next two in. To add some spacing between the figures we'll use the \hfill command. If you didn't want them all on the same line you could just leave blank lines instead of the \hfill commands. Please note that the indents I have used do not affect the how the code is processed, they just make it more readable. The beauty of these subfigures is that we can refer to each of them individually in the text due to their individual labels—but we can also give the whole figure a caption and label.
This is what our figure will look like in the document:
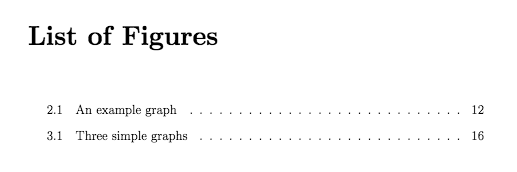
Now if we add a \listoffigures command just after the table of contents, LaTeX will generate a list of all the figure used in the thesis and inform us where each can be found:
Tables
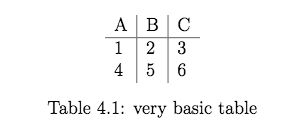
Now lets talk about tables. When writing a thesis you should enclose all your tables in the table environment. Here's a basic example:
\begin{table}[h]
\centering
\begin{tabular}{l | l | l}
A & B & C \\
\hline
1 & 2 & 3 \\
4 & 5 & 6
\end{tabular}
\caption{very basic table}
\label{tab:abc}
\end{table}
Again make sure you add both a caption and a label.
Subtables
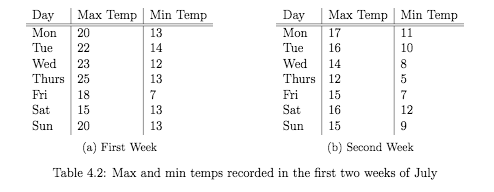
Just like with images, you may want to group tables together into a single table environment. This can be done by using subtable environments inside a table environment. Here's an example:
\begin{table}[h]
    \begin{subtable}[h]{0.45\textwidth}
        \centering
        \begin{tabular}{l | l | l}
        Day & Max Temp & Min Temp \\
        \hline \hline
        Mon & 20 & 13\\
        Tue & 22 & 14\\
        Wed & 23 & 12\\
        Thurs & 25 & 13\\
        Fri & 18 & 7\\
        Sat & 15 & 13\\
        Sun & 20 & 13
       \end{tabular}
       \caption{First Week}
       \label{tab:week1}
    \end{subtable}
    \hfill
    \begin{subtable}[h]{0.45\textwidth}
        \centering
        \begin{tabular}{l | l | l}
        Day & Max Temp & Min Temp \\
        \hline \hline
        Mon & 17 & 11\\
        Tue & 16 & 10\\
        Wed & 14 & 8\\
        Thurs & 12 & 5\\
        Fri & 15 & 7\\
        Sat & 16 & 12\\
        Sun & 15 & 9
        \end{tabular}
        \caption{Second Week}
        \label{tab:week2}
     \end{subtable}
     \caption{Max and min temps recorded in the first two weeks of July}
     \label{tab:temps}
\end{table}
Notice that in each \begin{subtable} command we've included a position specifier and a width. Again, we can give each subtable a label and caption as well as giving the whole table figure a label and caption.
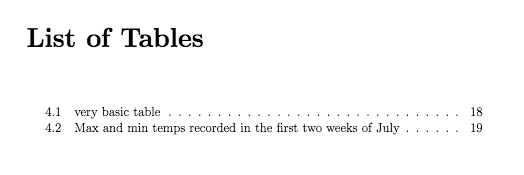
Now in the same way we added a list of figures after the table of contents we can add a list of tables using the \listoftables command.
This concludes our discussion on images and tables. In the next post we'll look at adding a bibliography to our thesis.