LaTeX Graphics using TikZ: A Tutorial for Beginners (Part 5)—Creating Mind Maps
Part 1 | Part 2 | Part 3 | Part 4 | Part 5
Author: Josh Cassidy (August 2013)
This five-part series of articles uses a combination of video and textual descriptions to teach the basics of creating LaTeX graphics using TikZ. These tutorials were first published on the original ShareLateX blog site during August 2013; consequently, today's editor interface (Overleaf) has changed considerably due to the development of ShareLaTeX and the subsequent merger of ShareLaTeX and Overleaf. However, much of the content is still relevant and teaches you some basic LaTeX—skills and expertise that will apply across all platforms.
In this post we're going to show you how to create mind maps using TikZ. To create this post we've adapted and simplified an example found in chapter six of the TikZ documentation, so if you want to go into greater detail on this topic, make sure you check out the extensive documentation.
To get started, we load up a the tikz package and the mindmap TikZ library. Next we open a tikzpicture environment:
\usepackage{tikz}
\usetikzlibrary{mindmap}
\pagestyle{empty}
\begin{document}
\begin{tikzpicture}


\end{tikzpicture}
\end{document}
For our example we'll make a mind map to display the different video series' we've made. We'll start by making a tree diagram and then we'll format it into a real mind map. We start the tree with the title or central concept. This is added in using a node:
\node{ShareLaTeX Tutorial Videos}
We can then give this node children, which are themselves nodes which can also have their own children and so on.
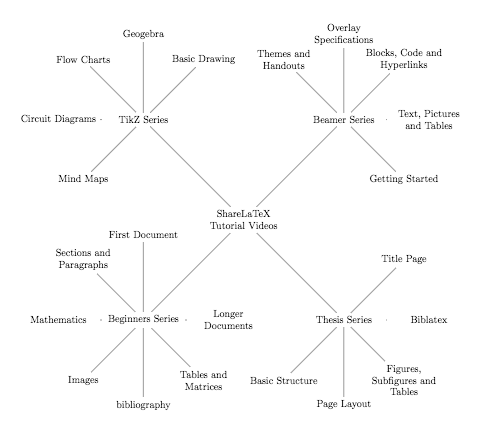
Let's add in four child nodes for the series titles. A child is inserted using the child keyword and then we specify a node in curly brackets. We close the original node statement with a semi colon just before the \end command. If we compile the code we can see our code has produced a sightly muddled tree diagram:
\begin{tikzpicture}

\node{ShareLaTeX Tutorial Videos}
	child { node {Beginners Series}}
	child { node {Thesis Series}}
	child { node {Beamer Series}}
	child { node {TikZ Series}}
;
\end{tikzpicture}

Let's add in the next layer of nodes and then we'll start formatting it to look more like a mind map:
\node{ShareLaTeX Tutorial Videos}
child { node {Beginners Series}
	child { node {First Document}}
	child { node {Sections and Paragraphs}}
	child { node {Mathematics}}
	child { node {Images}}
	child { node {bibliography}}
	child { node {Tables and Matrices}}
	child { node {Longer Documents}}
}
child { node {Thesis Series}
	child { node {Basic Structure}}
	child { node {Page Layout}}
	child { node {Figures, Subfigures and Tables}}
	child { node {Biblatex}}
	child { node {Title Page}}
}
child { node {Beamer Series}
	child { node {Getting Started}}
	child { node {Text, Pictures and Tables}}
	child { node {Blocks, Code and Hyperlinks}}
	child { node {Overlay Specifications}}
	child { node {Themes and Handouts}}
}
child { node {TikZ Series}
	child { node {Basic Drawing}}
	child { node {Geogebra}}
	child { node {Flow Charts}}
	child { node {Circuit Diagrams}}
	child { node {Mind Maps}}
};
To make the branches of our tree surround the central node we add the grow cyclic option into square brackets at the end of the begin command. We can also specify a text width and add the flush center alignment option in to tidy up our text:
\begin{tikzpicture}[grow cyclic, text width=2.7cm, align=flush center]
Next we'll specify styles for the different tree levels.
Level 1 is defined as everything coming out of the main parent node while level 2 is everything coming out of the first generation of child nodes. So in our example, level 1 is everything coming out of the ShareLaTeX tutorial videos title and level 2 is everything coming out of our series titles. To specify the styles for these levels we write the name of the level followed by a forward slash and full stop, then the keyword style, an equals sign and then the formatting options for the level in curly brackets. In the curly brackets we need to specify a level distance and a sibling angle:
\begin{tikzpicture}[grow cyclic, text width=2.7cm, align=flush center,
	level 1/.style={level distance=5cm,sibling angle=90},
	level 2/.style={level distance=3cm,sibling angle=45}]
The level distance is the distance between the centres of the child nodes and the centre of the node connected above it. We've set the level distances to 5cm in level one and 3cm in level two. This means that the distance between the mind map title and the series titles is 5cm and the distance between the the series titles and the individual videos is 3cm. The sibling angle is the angle between the branches. As we only have four branches at the top of level 1 we've given level 1 a sibling angle of 90 degrees. As we have many more branches coming out of the first generation nodes we've given level 2 a sibling angle of 45 degrees:

Our tree is now looking pretty good but to turn our tree into a proper mind map we need to make use of the mindmap TikZ library. To do this we add the keyword mindmap into the formatting options.
We also need to add the concept option to every node using this code: every node/.style=concept. Then we can set a default colour for all the nodes using concept color= followed by a colour. We'll choose an orange.
Finally we also need to add the key word append in after the full stop in our level style specifications:
\begin{tikzpicture}[mindmap, grow cyclic, every node/.style=concept, concept color=orange!40,
	level 1/.append style={level distance=5cm,sibling angle=90},
	level 2/.append style={level distance=3cm,sibling angle=45},]
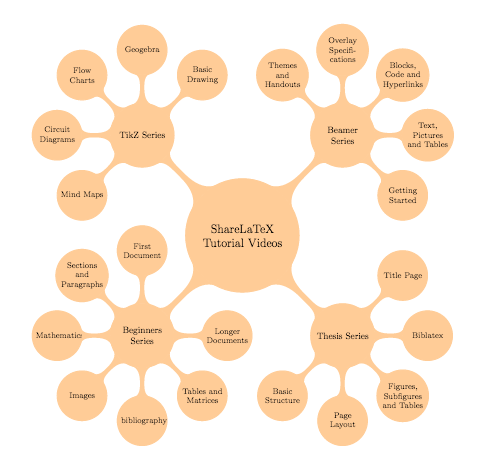
Now if we compile the code we'll see TikZ has generated some nice bubble shapes and links to turn our tree into an aesthetically pleasing mind map:

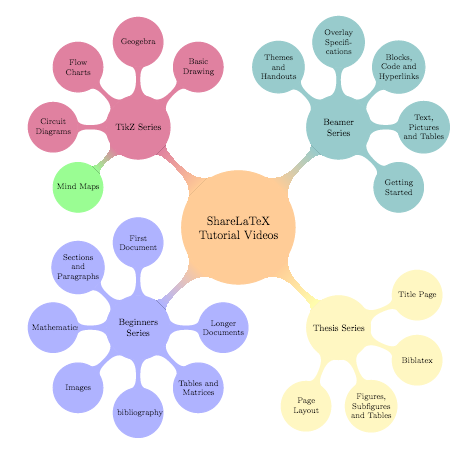
Finally we can edit the colours of the different nodes and their children. To do this we simply add a pair of square brackets after the keyword child and use them to specify a concept colour. Note that specifying a concept colour at this point will affect all the nodes down from it.
Let's give each of the four series a separate colour.
We'll also give the Mind Maps node a different colour as it is the one we are creating now:
child [concept color=blue!30] { node {Beginners Series}
...
child [concept color=yellow!30] { node {Thesis Series}
...
child [concept color=teal!40] { node {Beamer Series}
...
child [concept color=purple!50] { node {TikZ Series}
	...
	child [concept color=green!40] { node {Mind Maps}}

Notice that as we have set concept colors rather than just the color, TikZ has made nice transitions between colours on the branches.
This concludes our post on creating mind maps and our series on using TikZ. If you want to play around with the mindmap we created in this post you can access it here.
All articles in this series
- Part 1: Basic Drawing;
- Part 2: Generating TikZ Code from GeoGebra;
- Part 3: Creating Flowcharts;
- Part 4: Circuit Diagrams Using Circuitikz;
- Part 5: Creating Mind Maps.
Please do keep in touch with us via Facebook, Twitter or via e-mail on our contact us page.